
Are you up to date with the latest digital marketing statistics and trends?
If not, you’ve landed on the right post. This article is a compilation of interesting and reliable digital marketing statistics and trends that every marketer should know.
Knowing these data properly will help you have a better understanding of the marketing strategies that can work for your business.
To make it easier for you to navigate to the section that interests you the most, we’ve added the following table of contents.
So let’s get started.
1. Content Marketing Statistics
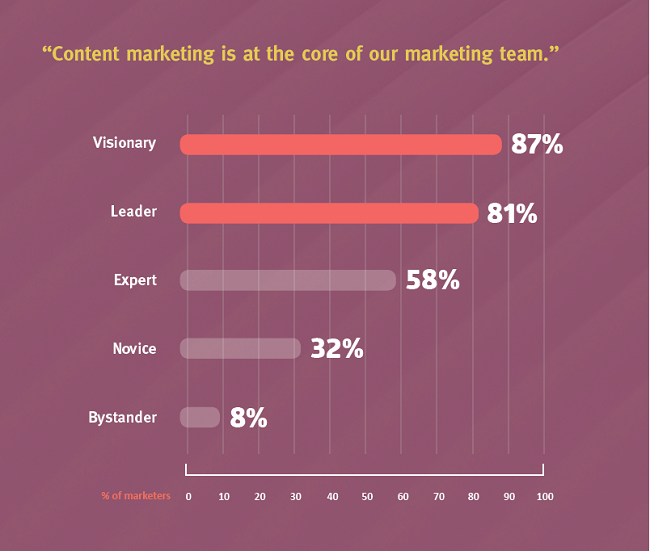
When it comes to digital marketing, content will always be the king. That’s the reason why 87% of the visionaries and 81% of the leaders put content at the core of their marketing strategies.
To flourish as a digital marketer, you’ll have to consistently produce amazing content that can engage your audience.
According to eMarketer’s report, 60% of Marketers Produce At Least 1 Piece of Content Every Day.
Your content can be in any form:
- Written content (Blogs)
- Video content
- Infographics (Visual Content)
- Webinars
- eBooks
- Whitelists
- Checklists
OrbitMedia conducted a survey and urged 1000 bloggers to participate in it. They found that time invested by bloggers in creating their posts widely varies.
Half of the bloggers spend less than 3 hours in creating their posts while just 1 out of 8 bloggers spend more than 6 hours per post. And the ones who dedicated more time are 56% more likely to yield better results.
You must have already heard that long and detailed posts get more shares than the shorter ones.
To confirm the fact, OkDork analyzed 10 of the most shared articles online. Their research showed that on an average content with 2000 and above words gets more shares than the shorter ones.
These posts are more likely to perform better if you add more visuals to them. Studies show that users can recall 65% of visual content even 3 days after they see it.
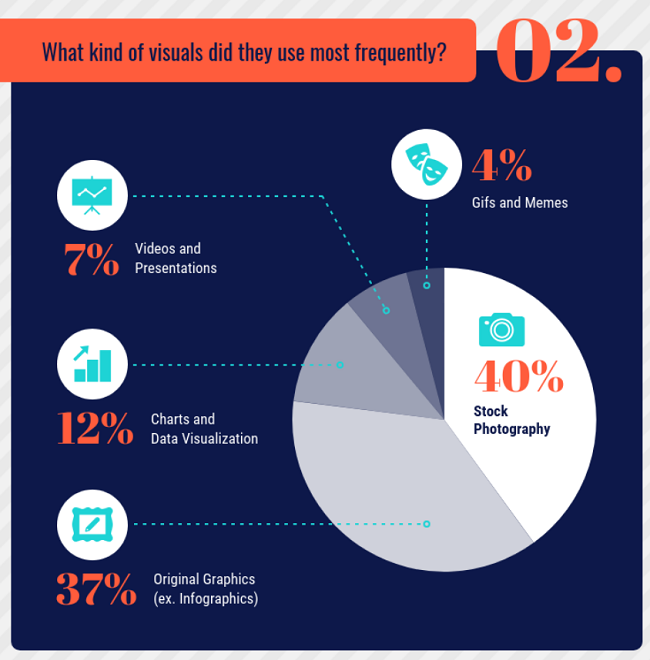
Nadya Khoja from Veengage surveyed 500 marketers to find out how visual content affects content marketing. 41% of them believed that infographics are the most valuable of all visual content. They even tend to outrank GIFs which are the internet’s most favorite file format.
And 37% of these marketers use original graphics.
But with so much done can you believe that only 1 out of 10 posts is compounding that aids organic traffic by strengthening its SEO and domain authority over time?
The remaining 9 are prone to decay more quickly even if they drive a surge of traffic in the initial phase.
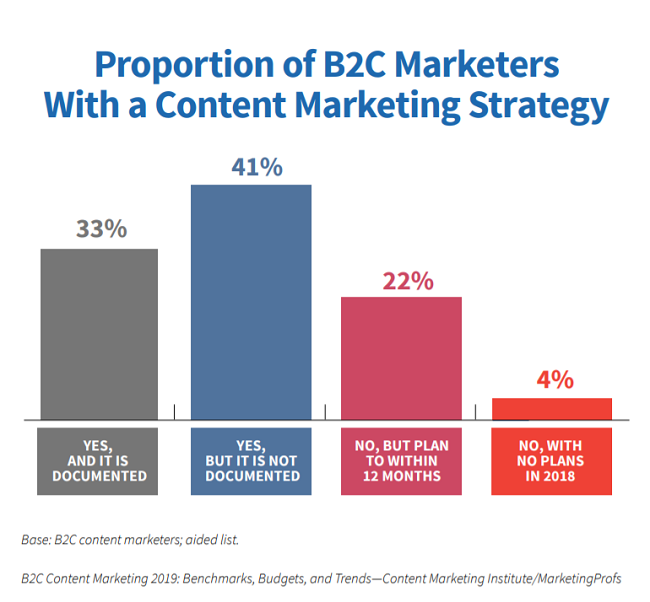
Surely, this 1 post comes from the 33% marketers who have a documented strategy. According to a report published on Content Marketing Institue, a documented content marketing strategy is often a key indicator of content marketing success.
And of course, you have to have some serious discipline when it comes to marketing your content. According to Skyword’s report, 100% of the visionaries use an editorial calendar.
After putting in all that effort when asked what are the metrics to measure the success of these posts 69% said its traffic. And 27% saw sales attribution as the metrics to measure their success.
It’s strange enough that 18% of these marketers don’t even care to measure the success of their content.
You for sure don’t want to belong to this 18%.
2. SEO Statistics
Content marketing and SEO strategies go hand-in-hand. You can’t really separate one from the other.
If you want your content to work, you have to optimize them properly so it appears on the 1st page of search results.
Studies show that 95% of searchers go to sites on the 1st page of Google SERPs. The bad news is that sometimes even if your post appears on the 1st-page, visitors may not bother to click on them. As Ignite Visibility reveals, half of the clicks on SERPs go to the top 3 results only.
The domains that appear on the 2nd page attract just 5% of search traffic. And the posts that appear on the 7th page gets only 3.5% of it.
A proper SEO strategy can help you find your way to the top 3 positions. In laying out your SEO plan, keep in mind that users are not looking up for generic terms. Instead, their search involves more specific phrases which are generally 4 words or longer.
But, as per a report by Skyword, the best content marketers are more focused on engagement and conversion rather than traffic. To be precise 96% of the visionaries wants engagement and conversion.

The good news is that leads from SEO have an average conversion rate of 14.6%. That’s where a strong SEO strategy comes in handy.
With that, you can have 51% of website traffic and 40% of your revenue from organic search.
Let’s now move on to look at some fascinating email marketing statistics.
3. Email Marketing Statistics
Email marketing undoubtedly is the most effective way to grow your business.
But it’s not easy to build a powerful email list. Do you know that only 43% of the consumers give their real email address when they come to a website that asks for an email before continuing?
What’s worse is that 80% of the real subscribers hit the unsubscribe button if they don’t wish to receive your emails any longer.
So even if you manage to have a list, be prepared for it to decay over just a few months. To have a list that can truly yield results, you need to scrub it from time to time so you know it’s clean.
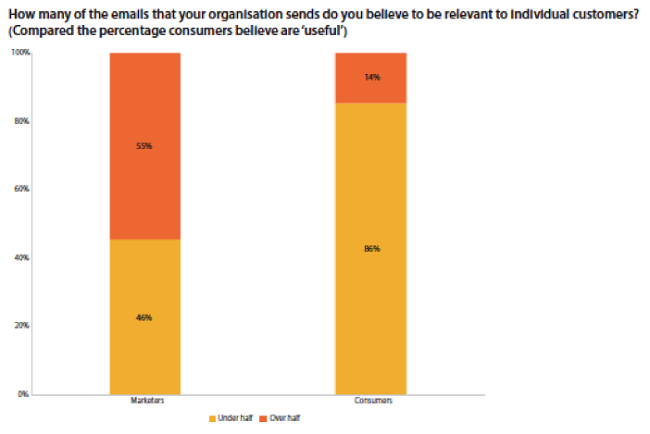
Studies reveal that 55% of the marketers believe that more than half of what they’re sending out is useful to their subscribers.
Unfortunately, a recent DMA 2019 Marketer Tracker Report showed that only 14% of consumers think that over half of the emails an organizationsends are relevant to them as individuals.
This definitely means that we as marketers have failed to deliver relevant content that our users want. Creating email content that users love can help you convert more easily.
If you aren’t sure which piece of content will work better, try split testing them. This will help you clear your doubts.
A good way to make your email marketing efforts a success is to segment your emails based on your user’s interest.
This can deliver a 100% click-through rate just because it contains what the users want to read about. It can also increase your open rates by 14.31%.
In 2016 Campaign Monitor conducted a survey and found that 68% of emails were opened on mobile devices.
This is a clear indication that the email marketing software you opt for should be able to deliver mobile-friendly emails to your users. This can increase open rates to a great extent.
Mobile users expect a level of responsiveness when they receive their mails. And 79% of emails get deleted if they appear ugly on their mobile screens.

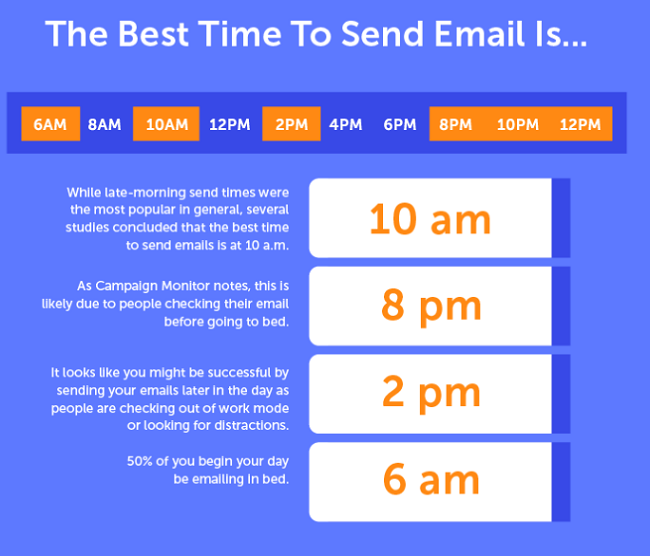
To help users achieve more open and clickthrough rates CoSchedule conducted a survey to know the best time to send emails. Here’s what they found.
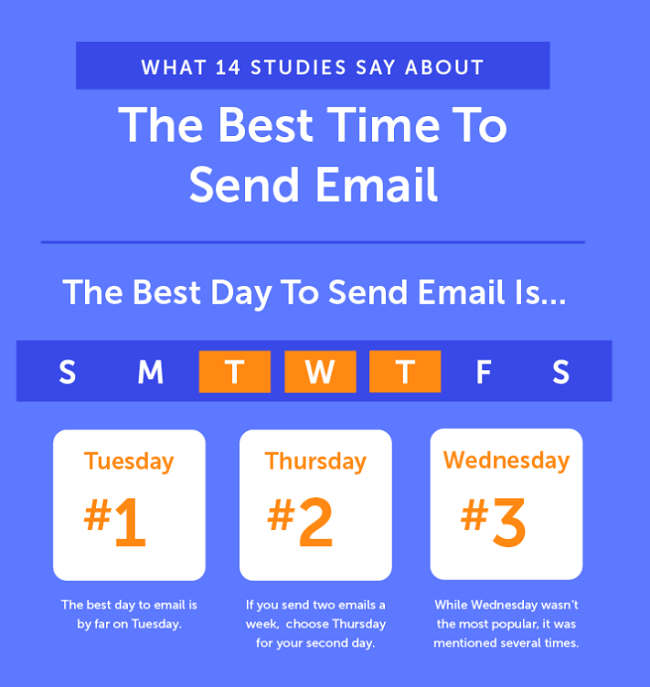
But what’s the best time of day to send your emails? Their reports reveal that sending your emails during prime time can increase your click/open rates. 10 am, 8 pm, 2 pm and 6 am were declared as the best times of the day to send out your emails.
Besides picking the right day and time to send your emails, personalizing the subject lines can increase your open rates by 26%.
All you need to do is add the name of the subscriber to the emails you send them. This makes your emails more engaging and the reader instantly feels more connected when they see you addressing them by their name.
If you’ve not started building a robust email list for your business, start working on it now. This list can yield dramatic results for your business.
According to a report published on Email Monday, your emails has an average ROI of $38 for each $1 spent.
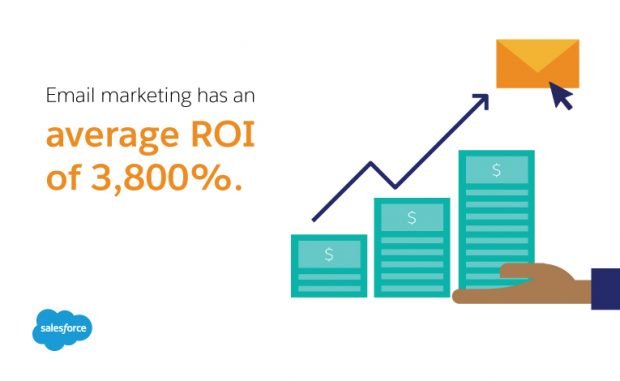
That’s amazing, isn’t it?
Let’s now move on to some social media statistics.
4. Social Media Statistics
Social media today has become an integral marketing platform for businesses across industries.
Currently, there are 4.3 billion internet users worldwide. And 80% of them have an average of 5.5 social media accounts.
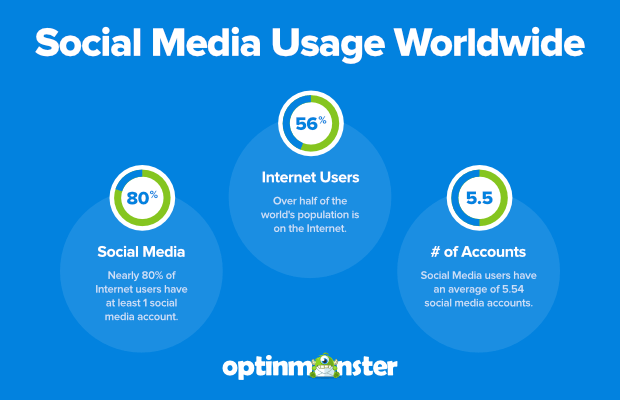
That’s a huge number and it is growing at an exponential rate per day.
To be more specific 366 million new people started using social media in the past year. That averages to more than a million new people joining social media every single day.
This clearly tells you how using social media marketing can impact your business.
According to Buffer’s annual report, 58.8% of the marketers consider social media as a major platform for executing their marketing strategy.
And if you’re still wondering, Facebook is the market leader here.
Yet it’s strange that when marketers were asked if they plan on increasing their use of dedicated social features to drive more sales, 51.9% replied with a no.
To explain this let’s look at this article published on the OptinMonster blog.
It says that no matter how popular social media becomes, it’s impossible for it to beat the popularity of email marketing. The image below tells you why.
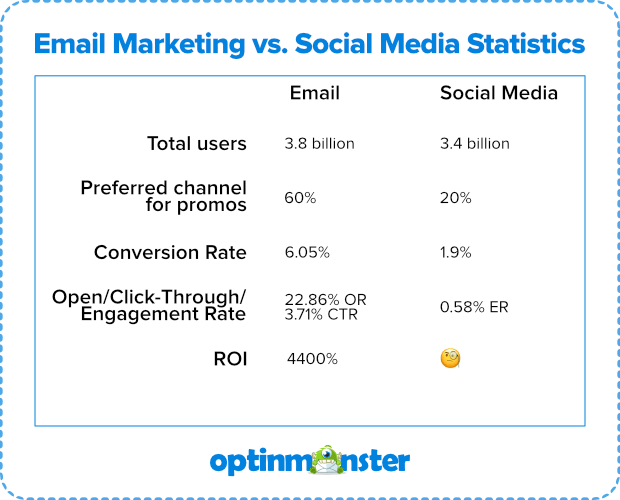
But they also believe that smart marketers will use both the platforms together to yield the best marketing results.
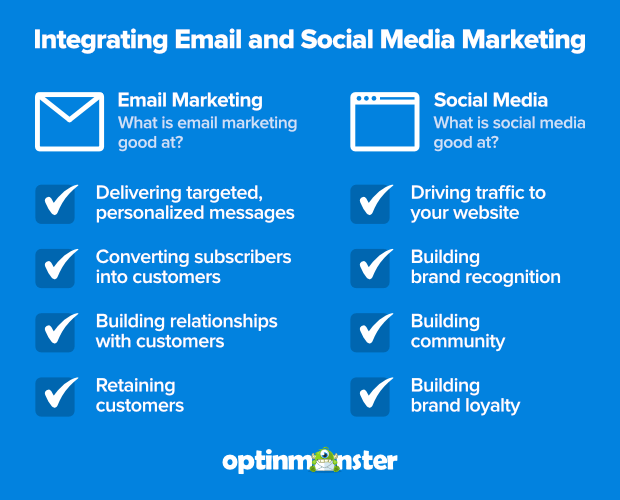
Social media can be used to drive visitors to your website. Once your visitor lands on your site you can use OptinMonster to convert those visitors into subscribers.
Then an email marketing service like Constant Contact can be used to build relationships with your subscribers and unlock that ROI.
5. Voice Search Statistics
With the ever-changing trends in digital marketing, voice search has become significantly popular and is here to stay.
Purna Virji from Microsoft says that 25% of searches conducted on Windows 10 taskbar are voice searches. According to ComScore, 50% of the searches will be voice search by 2020.
Even before 2020, voice search has highly influenced the lifestyle of modern consumers across the world.
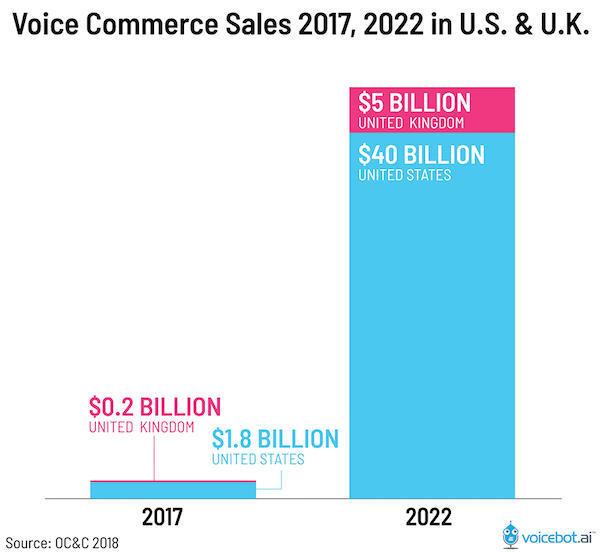
The increase in the number of smart speakers for household use in the United States of America and the United Kingdom between 2017-2019 will surprise you. Voice commerce sales are projected to increase over 2,000% from 2017 to 2022.
Voice search has become such an integral part of people’s lives, that today it has started shaping consumer’s behavior.
So it’s not at all surprising when 65% of people who own an Amazon Echo or Google Home say that they can’t imagine going back to the days before they had a smart speaker. 42% of that group say the voice-activated devices have quickly become essential to their lives.
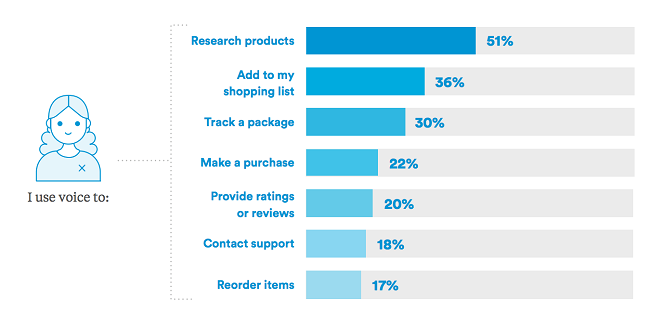
62% of these smart speaker owners have used voice commerce to purchase items. Voice search makes it quick and easy to find product information before making a purchase. 30% of internet users from the US have rightly taken advantage of this opportunity.
The use of this technology appears to be the highest amongst users in the age group of 18-29 years. Also, if you compare in terms of gender, men are more prone to using it as compared to women. 63% of all men are using this smart technology as compared to only 37% of the women.
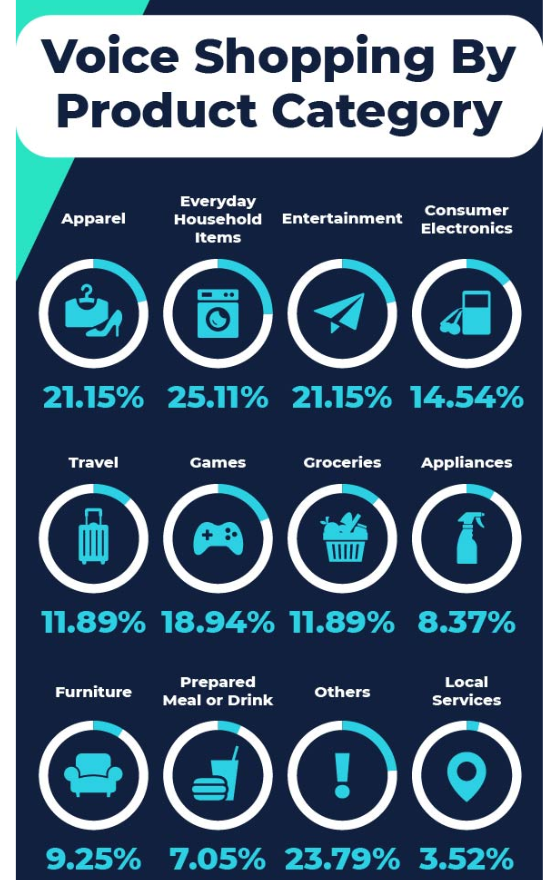
Studies also show that of all the products users buy online using voice search, household items top the list with an amazing 25.11%.
And 17% of these shoppers use voice search to reorder items.
In a report published by PR News Wire, voice-based shopping is expected to jump to $40 billion in 2022.
Marketers have already predicted 2020 as a year when voice search will explode. So now, with 2020 rapidly approaching, it’s high time to start optimizing your business for voice search if you haven’t done it already.
6. Mobile Marketing Statistics
A smartphone today is no longer just a mode of communication. It’s way more than that. Playing games, shopping online, watching movies, planning your travel – it has actually become a one-stop solution for everything.
According to a report by Statista in 2015, the estimated mobile users in 2020 were projected to be 2.87 billion. But when a similar survey was done in 2019 by the same organization, it was found that the total number of mobile users has already surpassed 3 billion.
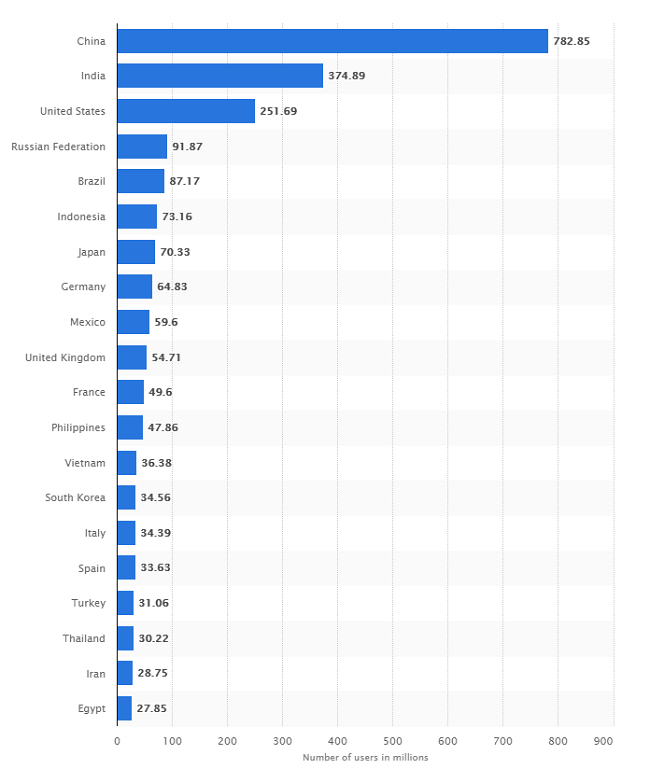
In 2018, China had the highest number of mobile phone users a whopping 782.85 million, followed by India and the USA.
According to a report published in Forbes, users spend 3.3 hours of their time on the phone every day.
Of the 3 billion mobile users, 62% use it to access the internet to gain instant access to different information right on the fingertips. Considering the user experience, speed and amazing features that mobile apps offer, many users prefer using mobile apps over mobile sites.
In 2018 alone, 194 billion apps were downloaded. Most of these apps were for gaming purposes. But a big share of this number went to shopping apps too.
According to a report on JMango, after news apps retail and eCommerce apps are the most launched apps as compared to other business applications.
When purchasing with smartphones, 51% of US-based users prefer mobile apps over mobile sites.
It’s noteworthy that users view 4.2x more products per session within apps, as compared to mobile sites. Apps also encourage more purchases with 3x higher conversion rates as compared to mobile sites.
By 2021, mobile devices will turn out to be the main driver of digital retail.
Read more interesting statistics on mobile marketing. Let’s turn to some CRO statistics now.
7. CRO Statistics
Can your digital marketing efforts be counted if you fail to convert your visitors?
Over the years we have realized that for an average marketer, getting traffic is not really the problem. But conversion is.
In an attempt to improve their conversion rates, companies are spending as much as $2000 a month on conversion rate optimization (CRO) tools.
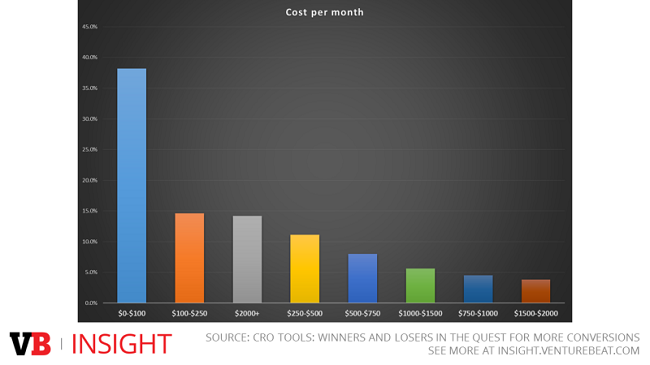
Venture Beat surveyed nearly 3000 CRO tool users and found that only 5% of them didn’t generate ROI. Conversely, they also revealed that the average ROI of these CRO tool users is 223%.
The same survey also discovered that 173 marketers gained returns that were higher than 1000%.
All the tools used by these marketers focus on the same goal. To convert visitors to leads and leads to customers.
It’s noteworthy that your conversion rates can increase manifold if your landing pages are well optimized. Some marketers, confuse landing pages with the homepage of their website.
Probably that’s the reason why 42% of the clicks generated by B2B marketers are directed towards homepages (according to iFactory Digital).
Studies also show that 48% of marketers create new landing pages for each marketing campaign.
If you’re not sure whether your landing page is going to work or not, don’t hesitate to split test them. A/B testing is the most popular form of CRO with 58% of marketers practicing it already.
Here’s a quick tip to help you come up with better landing pages. Landing pages that don’t ask age and telephone number convert better.
By using the correct testing and targeting methods, you can boost your conversion rates by up to 300%.
Navigation links can affect your conversion rates too. By removing them from your landing pages, you can increase your conversion by 100%.
16% of marketers have already put this point into practice.
Hubspot conducted a test to see which version of their landing page works better. On one they put the navigation links in the header and footer. On the second one, they removed all exit links.
The results found the second version with better conversion rates.
So these are some fascinating statistics and trends about digital marketing. Now it’s up to you how you use them to yield amazing marketing results for your business.
We hope you found this article helpful. If you did, do follow us on Twitter and Facebook for more content like this.
The post 80+ Verified Digital Marketing Statistics & Trends You Should Know (2019) appeared first on SeedProd.