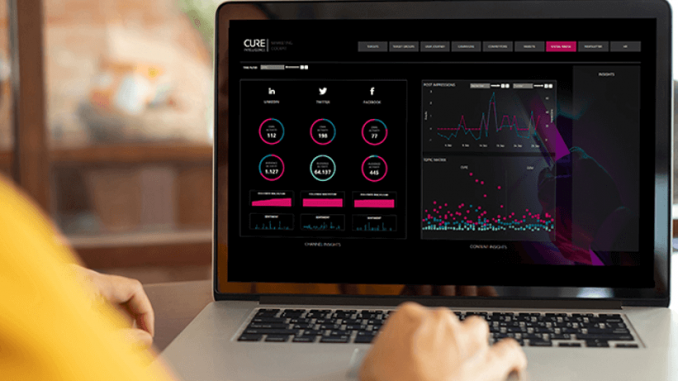
You probably know this: Information and data are carefully compiled from all possible platforms for a descriptive report on marketing or PR campaigns. This includes information from websites, social media channels, ads manager, material from supporting agencies, media analytics, internal sales data, etc. – a struggle! A that keeps your marketing and communications goals in front of you at all times is a far better solution. Here is how it works.
Which sources and data can (and should) be integrated?
First, a basic overview of possible data sources and formats needs to be established. Almost any source can be integrated into a performance cockpit like website analytics, social media analytics, google search results and ad KPIs, keyword-based topics in web and social media, newsletters, print, tv/radio and podcasts or data from rating portals, sales and revenue results, risk data etc.
The integration of the data takes place in (partially) automated processes and can be realized in different time intervals (daily, weekly, monthly, etc.). Important is the segmentation, standardization and qualification of the content. The focus lays on the individual goals and issues of a respective business division as well as its strategic alignment at the management level.
The variety of data makes the ideal selection difficult at times. Not every aspect of a source is always relevant. On the other hand, different metrics and dimensions from diverse sources that have never been considered in relation to one another can provide valuable insights. This potential must be exploited and bundled into meaningful KPIs and smart insights that support the management and decision-making processes.
Performance Cockpits – Ideal design for a perfect usability
The visualization of KPIs and insights takes place in an interactive web application. Therefore, the performance cockpits can be accessed easily and conveniently via web browsers on any device (desktop, notebook, tablet, smartphone).
Rule number one for the design of the performance cockpit: Usability first! Hence, the cockpit is clearly structured, uses filters and does not appear overloaded. The individual widgets and diagrams are straightforward and easy to understand. Questions about the primary goals, one’s own marketing and communication activities and their evaluation are also very crucial for the layout:
- What are my marketing and/or communication objectives?
- What strategy do I follow to achieve the goal?
- How do I want to achieve the goal?
- When have I reached my goals – which KPIs can I use to evaluate the achievement of these objectives?
Certainly, the biggest advantage is that only one tool needs to be used for all relevant objectives and references. Deep dives and details can also be generated via sub-dashboards in the same design. This simplifies the training of new colleagues additionally.
From theory to practice – CURE Performance Dashboard
At we focus on the individual channels and present them via navigation tabs. This allows us to evaluate and compare each marketing activity and channel individually, such as social media KPIs, -newsletter data, data from website analytics, etc. The social media tab displays important KPIs, such as engagement, impressions, and followers as well as the sentiment of posts:
Example of a social media dashboard – by CURE Intelligence
If social media plays an important role for your business, enjoy the clear display of your post impressions or visits over time: This shows you if posts perform better at certain times or days!
In addition to social media data, important website analytics can be integrated: Devices, KPIs such as page views, bounce rate, duration, and sources, etc. …
Example of a website analytics dashboard – by CURE Intelligence
Page views can also be displayed. Based on the display of this data, you know which pages are viewed the most, are visited the longest, and cause the continuation of the customer journey or result in the abandonment of the site.
You can also ad an overview about your google ads campaigns:
Example of a campaign dashboard – by CURE Intelligence
External Data Intelligence expertise allows you to reach your goals faster
Never before has an amount of data on marketing and communications activities been available like today. But they are often only marginally or not at all taken advantage of, even though the superiority of data-based decision-making and control has been proven in many studies. There are many reasons for that: Lack of knowledge about the platforms, data silos and “departmental thinking,” missing affinity for “dry” data acquisition, aggregation, or processing as well as too little experience regarding relevant metrics, missing benchmarks, or limited means of visualization – and simply too few resources. Get ahead with the help of external experts, who will take over the development of a performance cockpit that is right for you. Experience shows that this can be realized in a few weeks. Benefit immediately from a better overview, save time on reporting, and focus on the qualitative design of your marketing and communication activities now.
About the author:
is a partner and Managing Director at CURE Intelligence (), which was founded in 2009 and has offices in Luxembourg and Germany. He is your contact person for in marketing, communication and business intelligence, e.g. social media marketing, media monitoring and analysis or predictive analytics. Happy to connect and work together!
This article is brought to you by and reflects only the opinion of the author.
The post Digital Marketing & Communications Dashboard appeared first on Silicon Luxembourg.

Leave a Reply