
Review of: SEMrush (plus tutorial)
Use Cases: SEO, PPC and more.
All-in-one digital marketing platform with numerous Toolkits for SEO, PPC, and more.
The interface is easy to navigate, and all the tools work well with on another.
At $99.95/ month, it’s not the cheapest, but it does provide multiple toolsets in one platform.
Loads of tutorials, documentation, free training courses, and a responsive support team.
Looking for a comprehensive SEMrush review? This guide will cover every inch of the platform, including 38 practical applications.
If you’re trying to create high-preforming digital marketing campaigns for your business, boss and/or clients, you need a strong toolset.
The problem? The more tools you buy for specific areas of a campaign – SEO, PPC, etc – the more costs skyrocket.
Think about SEO alone:
Keyword research tool…$100+/month.
Rank tracking tool…$100+/month.
Backlink analysis tool…$100+/month.
SEO audit software…$100+/month.
And you’re just getting started. You haven’t even looked at other channels like PPC or social media. Before you know it, you’re spending over $500+/month on marketing tools.
Not to mention:
Each tool comes with a learning curve, and often won’t integrate with other tools in your marketing stack.
The solution?
SEMrush (affiliate).
In this review, I’m going to show you EVERYTHING SEMrush can do, and walk you step-by-step through 38 practical applications of the tool you can use to perform deep competitor analysis and build successful digital marketing campaigns.
Before we get started, make sure you grab one of the free trial links below so you can follow along step-by-step with this review and implement the action items:
SEMrush Free Trials: Test Drive SEMrush PRO for 30 Days, GURU for 14 Days or PRO + Traffic Analytics for 14 Days
Disclosure: There are affiliate links in this article. If you decide to purchase a tool through one of those affiliate links, I will receive a commission at no additional cost to you. I only promote tools I personally use in my business.
SEMrush is NOT a standalone “SEO” or “Competitor Analysis” Tool…
Let’s clear the air on a couple things:
- SEMrush is notan SEO tool.
- SEMrush is not a competitor analysis tool.
Sure, it is one of the top tools, if not the best, in each category as voted here, here and here.
But, in recent years, SEMrush has morphed into much more.
Now, it is truly an all-in-one digital marketing platform comprised of numerous Toolkits designed to help you succeed across different areas of your campaign – SEO, Advertising, Content Marketing, Competitive Research and Campaign Management.
The fact that it packs so much firepower, for less than many standalone tools, is the reason millions of agencies and marketers are using the SEMrush.
In fact, SEMrush is used by over 4 million users, including the digital marketing teams at 25% of the Fortune 500 companies, and 7 out of 10 of the world’s top advertisers.
|
SEMrush Statistics (Source) |
|---|
|
Keywords in database (Total) |
|
|
URLs crawled per day (Total) |
|
|
Referring domains in database (Total) |
|
|
Backlinks in database (Total) |
|
|
Advertisers in database (Total) |
|
|
Publishers in database (Total) |
|
|
Ads in database (Total) |
|
We’ll jump into practical applications for each SEMrush Toolkit in the review below, but here is a quick overview of each one:
Get an unfair behind-the-scenes look at your competitor’s SEO, PPC, and overall online traffic strategy. Use the insights to build campaigns with a proven track record of success.
Analyze competitor link profiles, perform in-depth keyword research, track rankings, identify on-page issues and run technical site audits from one central SEO project dashboard.
Research competitor PPC campaigns – text, display and PLAs – at the keyword, ad copy, and landing page levels. Use the insights to reduce wasted ad spend, and build profitable campaigns.
Perform content audits, build content templates, find new topic ideas, use the content analyzer to uncover on-page opportunities, and order articles from a of verified writers.
Manage all your campaigns and projects – link building, rank tracking, PPC, site audits, social media, brand monitoring etc – from one dashboard. Get real-time notifications and build white label reports.
If Google Analytics and SimilarWeb had a baby, this would be it. The tool allows you to find out which channels – organic, paid, referral, social etc – are driving traffic to a site, and analyze engagement metrics across each one.
Editor’s note: While SEMrush provides countless use cases, it won’t do the work for you.
Truth is: Many people get excited about everything the platform can do, sign up for a free trial, and only realize a fraction of the value it can provide.
That’s why this review is
not going to be another feature dump. Instead, it will show you step-by-step how to use SEMrush to drive real results for your business.
To help you navigate the guide, I have included jump links below, as well as a downloadable PDF version of the review.
Grab your free 30-day trial here and follow along.
Let’s jump in!
|
SEMRUSH REVIEW: TABLE OF CONTENTS |
|
|---|---|
|
|
#22: Monitor SERP volatility |
|
#1: Collect benchmark data |
#23: Optimize on-page content |
|
#2: Identify top search competitors |
|
|
#3: Analyze competitor keywords |
#24: Analyze competitor paid traffic |
|
#4: Perform keyword gap analysis |
#25: Assess PPC competition levels |
|
#5: Find existing keyword opportunities |
#26: Reduce wasted ad spend |
|
#6: Identify secondary keyword ideas |
#27: Write better ad headlines |
|
#7: Find long tail keyword ideas |
#28: Uncover high-converting ad formulas |
|
#8: Analyze SERP competition |
#29: Uncover competitor pricing strategies |
|
#9: Check desktop vs. mobile traffic |
#30: Find competitor PPC gaps |
|
#10: Set a keyword difficulty baseline |
#31: Dissect display ad performance |
|
#11: Analyze traffic strategies |
#32: Build PPC reports |
|
#12: Check competitor traffic sources |
|
|
#13: Remove toxic backlinks |
#33: Run technical content audits |
|
#14: Find new link prospects |
#34: Build SEO content templates |
|
#15: Land high quality links |
#35: Improve readability with SWA |
|
#16: Identify “linkable” asset types |
#36: Monitor brand mentions |
|
#17: Find (and fill) backlink gaps |
|
|
#18: Reclaim lost backlinks |
#37: Review projects in one dashboard |
|
#19: Identify broken link opportunities |
#38: Build white label reports |
|
#20: Analyze backlinks at scale |
|
|
#21: Track keyword rankings |
|
The Ultimate 38-Part SEMrush Review and Tutorial (2020 Edition)
In this review and tutorial, we’re going to cover the entire SEMrush Toolset. But we’re not going to focus only on features – I’ll also show you how to leverage each toolkit to drive immediate value for your business and/or clients.
SEO Toolkit Review and Tutorial
The SEO Toolkit contains over 15 tools and reports for the following five areas of SEO:
- Competitive Research
- Rank Tracking
SEMrush Free Trials: Test Drive SEMrush PRO for 30 Days, GURU for 14 Days or PRO + Traffic Analytics for 14 Days
#1: Collect Benchmark Data
Before starting any competitor analysis, it’s always a good idea to look at how you’re currently performing across organic and paid search channels.
Here’s how to do that…
In SEMrush:
- Select SEO Toolkit.
- Click on Domain Overview from the side menu.
- Enter the domain – e.g. “robbierichards.com” – you want to analyze.
- Click Search:
The report shows your high-level data, including:
- Organic search
- Paid search
- Backlinks
- Display advertising
As you scroll down the page, you can see more details, including:
- Top organic keywords
- Organic position distribution
- Main organic competitors
- Competitive positioning map
Scroll back up and click the PDF button at the top of the page. Now you can download the dated report and benchmark your data.
Use the data on the overview dashboard to establish some baseline benchmark metrics:
- How much organic traffic are you getting?
- How many backlinks do you have pointing to the site?
- How much paid traffic (if any)?
- How many keywords do you have ranking in the top three search results?
Save this data in a spreadsheet.
You can return to these metrics periodically and see if your SEO and PPC efforts are proving effective.
#2: Identify Your Top Organic Search Competitors
The next step is to identify your top organic competitors.
In SEMrush:
- Select SEO Toolkit.
- Click on Organic Research from the side menu.
- Enter the domain – e.g. “thewirecutter.com” – you want to analyze.
- Click on the Competitors tab:
The Competitor Positioning Map highlights the top organic search competitors.
For each domain, you can see the number of keywords ranking in the Top 100 search results, as well as the volume of organic search traffic. In our example, you can see that Techradar and PCMag are top competitors of Wirecutter.
Hover over the bubbles to see the exact numbers for each domain:
Scroll down from the Competitor Positioning Map, and you’ll find the Organic Competitors report:
This table highlights lesser-known organic competitors, and allows you to drill-down and find loads of actionable data.
You can see in the table we’ve instantly been able to uncover 274,856 potential competitors.
Much quicker than trawling through Google!
Pay close attention to the following metrics in the table:
- Competition Level – the larger the number of common keywords, the higher the level of perceived competition.
- Common Keywords – the keywords for which multiple domains rank in the top Google search results.
- SE Keywords – the number of keywords bringing visitors to a website via Google’s Top 100 organic search results.
These metrics will reveal your top organic search competitors.
I’d recommend starting with the Common Keywords column to filter out the domains currently ranking in the Top 100 search results for the same keywords you’re ranking for.
The more common keywords, the stronger the competition.
Select a domain from the Organic Competitors table that has a high number of common keywords. This is the first competitor you’ll be analyzing in greater detail.
#3: Take a Behind-The-Scenes Look at Your Competitor’s Organic Search Traffic (Folder, Page, and Individual Keyword Level)
Having identified your competitors in step #2, SEMrush allows you to get an ‘All Access Backstage Pass’ to see how your competitors are driving traffic at the subdomain/subfolder, page/post, and individual keyword levels.
You can use this data to create a proven roadmap to quickly scale your organic traffic across each stage of the funnel.
Top-level organic traffic view
Let’s start with an overview of all the organic traffic for Wirecutter.
In SEMrush:
- Select SEO Toolkit.
- Click on Organic Research from the side menu.
- Enter the domain – e.g. “thewirecutter.com” – you want to analyze.
- Click on the Overview tab:
The Overview report shows the total organic traffic and keywords for the domain. You can see that Wirecutter has 2.5 million keywords in the Top 100 and expects to get 4.5 million visits per month.
OK, let’s dig a little further…
Folders
Using filters in SEMrush, you can find which subfolders drive the most organic search traffic. For example, Wirecutter houses its product reviews in a URL subfolder called “/reviews/”:
Let’s see how much of their investigational intent traffic goes there.
In SEMrush:
- Select SEO Toolkit.
- Click on Organic Research from the side menu.
- Enter the domain – e.g. “thewirecutter.com” – you want to analyze.
- Click on the Positions tab.
- Apply advanced filters: Include > URL > Containing > /reviews/
Now the results show the keywords and traffic found only in the “/reviews/” subfolder:
You can see that Wirecutter gets 4.1 million visits per month (91% of the total traffic) and has 2.2 million keywords (88% of all keywords) in its “/reviews/” subfolder, which is where they generate their affiliate revenue.
OK, now let’s check the ecommerce site, Beardbrand, who house all their products under the “/collections/” subfolder:
This time we’ll apply the advanced filters to discover the commercial intent traffic.
In SEMrush:
- Select SEO Toolkit.
- Click on Organic Research from the side menu.
- Enter the domain – e.g. “beardbrand.com” – you want to analyze.
- Click on the Positions tab.
- Apply advanced filters: Include > URL > Containing > /collections/
Now the results show the keywords and traffic found only in the “/collections/” subfolder:
Overall, Beardbrand has 40.9K keywords in the Top 100 and expects to get 147K visits per month. But its commercial intent product category pages only drive a small proportion with 546 keywords and 15.5K (11%) traffic.
Pages/posts
You can also check which individual pages are driving the most traffic across each stage of the funnel. This tells you which topics (rather than keywords) your competitors are targeting.
Let’s check the top traffic-driving commercial intent pages for Beardbrand.
In SEMrush:
- Select SEO Toolkit.
- Click on Organic Research from the side menu.
- Enter the domain – e.g. “beardbrand.com” – you want to analyze.
- Click on the Pages tab.
- Apply advanced filters: Include > URL > Containing > /collections/
For Beardbrand, you can see their Beard Oil page gets 8.7K visits per month – that’s 5.9% of the total traffic – and is by far their highest traffic-generating commercial intent topic.
Keywords
Finally, let’s look at which keywords are driving the most traffic. But rather than using URL filters, we’ll check for investigational intent keywords that use modifiers like best, top, review, and comparison.
In SEMrush:
- Select SEO Toolkit.
- Click on Organic Research from the side menu.
- Enter the domain – e.g. “thewirecutter.com” – you want to analyze.
- Click on the Positions tab.
- Apply advanced filters: Include > Keyword > Containing > best
The report shows that Wirecutter uses 257.2K investigational intent keywords to drive 1.3M visits per month – that’s 28.9% of their total traffic.
Bonus Resource: How to Find High-Value Competitor Keywords (Actionable 5-Step Guide)
#4: Perform an In-Depth Keyword Gap Analysis
The SEMrush lets you make direct comparisons with up to five of your competitors by uncovering keywords they rank for, but you don’t.
For example, you can discover:
- What keywords are unique to your competitor
- What keywords you have in common
In this example, Healthline is analyzing its competitor, WebMD.
IMPORTANT: You MUST enter your competitor’s domains first, with your own domain last on the list.
In SEMrush:
- Select SEO Toolkit.
- Click on Keyword Gap from the side menu.
- Enter the domains you want to compare – e.g. “webmd.com” and “healthline.com”:
Then select the type of intersection – e.g. “Unique to the first domain’s keywords”:
The report shows that there are 4,119,519 keywords unique to WebMD:
But a lot of those are low-ranking keywords.
So to make the report more relevant, we’ll add an advanced filter to find the competitor keywords ranking in the Top 10:
Now you can see a list of high-volume Top 10 ranking keywords unique to WebMD that Healthline could target:
#5: Find All Your Existing Keyword Opportunities
If you only perform keyword research for new content, then this tactic is a game-changer. And it’s one I’ve used on my blog on countless occasions:
Increasing organic traffic by as much as 402% month over month:
The blog post above went from position #8 to #2 overnight, which is why the traffic shot up like a rocket!
This tactic allows you to take existing content that’s underperforming and optimize it in such a way that it generates near-immediate traffic gains.
In SEMrush:
- Select SEO Toolkit.
- Select Organic Research from the sidebar menu.
- Enter the domain – e.g. “magento.com” – you want to analyze.
- Click on the Positions tab:
The results show all the top-ranking keywords. But you only want to target the low-hanging
keywords that can be optimized, so use the Positions filter to find keywords ranking in positions #6 to #20:
Now you have 14.8K keywords (instead of 121K) that you can target.
You can drill down further by selecting subfolders to target, as we did in the previous section.
Once you’ve selected the pages to optimize, export the results as a ‘.CSV’ file. Then copy/paste the data into the sheet labeled “1. SEMRush Export” in the Google Sheet below.
In the DONE tab, you should now see something like this:
The rows with the most GREEN in them signify the MOST ATTRACTIVE opportunities.
For more details on this technique, check out this post.
Editor’s Note: If you want to learn the exact keyword research processes I use to scale organic traffic for my clients, check out my premium training course, .
You’ll learn how to find, qualify, prioritize and map keyword data:
Screenshots of the Aggregate and Keyword Mapping tabs in .
#6: Expand Your Organic Footprint with Secondary Keyword Analysis
A single page can rank for hundreds or even thousands of different keywords depending on the niche and type of content.
For example, Wirecutter’s top pages rank for thousands of keywords:
But if you dig a little deeper, you’ll find that the primary keyword only brings in a small proportion of the traffic. And the remainder comes from secondary keywords.
For example, take a look at the Wirecutter page for the best mobile scanning apps. The primary keyword – scanner app – brings in 115,620 visitors – that’s 2.55% of the page’s overall monthly organic traffic. The remaining 97.45% comes from the other 5,529 semantic and long tail secondary keywords:
Here’s how to expand the organic keyword footprint on your pages with secondary keywords related to the primary topic.
In SEMrush:
- Select SEO Toolkit.
- Select from the sidebar menu.
- Enter the primary keyword – e.g. “scanner app” – into the search bar.
- Click Search:
From the results list, you can find thousands of related long-tail keywords:
On the left-hand side are groups of keywords. For example, you could click on “barcode” to show all the keywords related to “barcode scanner apps”:
Look through the results to see which related keywords you want to add to your content.
Note: You can also use these secondary keyword ideas to create new posts or pages.
SEMrush Free Trials: Test Drive SEMrush PRO for 30 Days, GURU for 14 Days or PRO + Traffic Analytics for 14 Days
#7: Find Piles of Long-Tail Keywords (With Specific Search Intent) Using the Keyword Magic Tool
Staying with the Keyword Magic Tool, let’s see how we can find specific search intent long-tail keywords.
Another of Wirecutter’s top pages is their review of Air Fryers:
When you enter the primary keyword – air fryer – into the Keyword Magic Tool, you get a staggering 101,194 related keywords:
But, say you’re only interested in mid-funnel investigational intent keywords? Then you can use the groups of keywords in the left-hand menu to find keyword modifiers like “best”:
And now you have 2,778 keywords related to “best air fryer”, such as “best air fryer recipes”, “best air fryer consumer reports”, and “best-rated air fryer”.
You can use the list to drill into the most valuable long-tail keyword ideas. But if you don’t see a related keyword topic in the left-hand menu, you can use the “Advanced Filters” to add a keyword to the “Include keywords” area.
For example, you could add the words “best” and “potato” to refine the results to keywords containing both words:
Now the results look like this:
You have 35 long-tail keywords containing both “best” and “potato”, such as “best potatoes for french fries in air fryer” and “best air fryer potato chips”.
#8: Find Out Where Competitors Are Getting the Upper Hand in the SERP
So far, you’ve managed to identify your top organic search competitors, find all the keywords they rank for, identified their top-performing content, and unearthed loads of potential long-tail keywords to target.
So what’s next?
In this step, you’re going to find all the common keywords where your competitors are ranking higher than you in the SERPs.
In SEMrush:
- Select SEO Toolkit.
- Select Organic Research from the sidebar menu.
- Enter the domain – e.g. “thewirecutter.com” – you want to analyze.
- Click the Competitors tab:
Scroll down the page to the Organic Competitors table and click on the Common Keywords for one of your competitors – e.g. techradar.com:
A new window/tab opens in SEMrush, with the Keyword Gap details pre-populated:
Scroll down the page to the results table listing all the keywords both Wirecutter and their competitor TechRadar are ranking for in the Top 100 search results:
But, to narrow the selection, let’s add a filter, so we only see the results for TechRadar ranking in the Top 10 results:
Now you have a list of results that you can target:
For example, TechRadar ranks in position #5 for the keyword “Chromebook”, while Wirecutter is just outside the first page in position #11. This looks like an excellent topic to target and improve as the gap is small.
Other keywords might need a lot of work. For example, the keyword “new iPhone” shows TechRadar in the top spot with Wirecutter way down in position #77.
Export and/or filter the data (as above) to show your competitor’s top-ranked common keywords.
This view will show you all the keywords where your competitor is ranking highly, but you are not. These are immediate areas of potential growth.
Click on one of the common keywords and identify which content they are using to rank for it.
Click through to the post and analyze the content.
Are there any glaring signals pointing to why this page ranks and yours doesn’t?
Take these insights and start optimizing your existing competing content to gain quick wins in the SERPs.
Here are a couple ways to sort the data to get some valuable insights:
- Sort by CPC to find high commercial intent keywords that you can use to attract more bottom-of-the-funnel traffic.
- Sort by search volume to find keywords that are bringing your competitors a lot of traffic from the SERPs. Often, you’ll come across several keywords you had never considered, but could easily be ranking for.
#9: Gain Additional Insights from the Desktop vs. Mobile Keyword Report
Google has stated that almost 60% of searches take place on a mobile device.
But did you know that Google will also often rank keywords in different positions on mobile vs. desktop?
This means that a #1 ranking on desktop doesn’t always translate to a #1 ranking on mobile.
You can use the mobile vs. desktop reports in SEMrush to glean additional insight into how your website — or a competitor’s website — is faring on both desktop and mobile.
For example, let’s take a look at my website.
In SEMrush:
- Select SEO Toolkit.
- Click on Organic Research from the side menu.
- Enter the domain – e.g. “robbierichards.com” – you want to analyze.
- Click on the Positions tab:
Within the Positions report, you can switch between Mobile and Desktop to see the number of keywords the website is ranking for, the amount of traffic it gets, and the estimated traffic cost for both mobile and desktop.
Here’s my desktop stats:
And my mobile stats:
In my case, I still have more keywords and traffic on desktop compared to mobile.
We can also see exact rankings between mobile vs. desktop for specific keywords.
For example, here’s where this page ranks on desktop:
So you can see there is a variation in ranking position and traffic volume.
It’s not unusual to see a slight variation between desktop and mobile rankings but, in my experience, a significant difference may indicate that your page isn’t optimized very well for mobile.
You can check this using the SERP preview tool in SEMrush.
On desktop:
In our example, you can see it looks perfectly fine on both desktop and mobile.
If you notice any significant discrepancies between mobile and desktop rankings or notice that your website doesn’t look great on mobile/desktop (according to the SEMrush SERP preview), it’s worth checking on an actual mobile device to see if the page is well-optimized for mobile.
#10: Establish a Keyword Difficulty Baseline (And See If You Can REALISTICALLY Outrank the Competition)
You’ve found dozens of potential keywords to target.
But, what are the chances of actually ranking for them?
The last thing you want to do is invest a lot of time, money, and resources into targeting keywords you might not ever rank for.
The SEMrush allows you to simultaneously assess the level of competition for a large batch of keywords. Which can save you a lot of time having to filter excel spreadsheets and manually review keyword competition within the Organic Research Position reports.
In SEMrush:
- Select SEO Toolkit.
- Click on Keyword Difficulty from the side menu.
- Enter a list of your target keywords.
- Click on the Show Difficulty button:
You’ll then see a table that lists the following:
- Keyword difficulty percentage
- Search volume
- Number of search results (for the query)
- SERP features overview (this tells you if there are featured snippets, instant answers, site links, featured videos, etc. in the search results)
- Keyword trend overview (this is a graph of how search volume differs across various months – looking at this will give a good indication as to whether the keyword is highly seasonal, or not)
- SERP snapshot (i.e. a snapshot of the top 10 ranking pages)
Basically, the higher the keyword difficulty percentage, the more difficult it will be to rank for those keywords.
NOTE: If you click on a keyword, it will take you to the Keyword Overview report, and shows you which of your competitors are already ranking for that search term, along with the corresponding URL(s).
Also, if you want to see volumes and difficulty scores for other countries – e.g. UK, Australia, etc. – simply select an alternative country from the dropdown menu at the top of the page:
Not all keywords are created equal. Some are more competitive than others.
Targeting the wrong terms can result in a LOT of wasted time and money.
As a result, you want to focus on only the competitor keyword opportunities you can realistically rank for in say the next 3-6 months.
One of the best ways to narrow down the competitor keyword set to these terms is to establish a keyword difficulty baseline.
I’ll show you how to quickly set this baseline using SEMrush (affiliate) in the video below:
Use this to automate the process.
Make a note of your keyword difficulty baseline across each relevant intent bucket – informational, investigational, and commercial – because you’ll be using this to narrow down the competitor keyword opportunities later on.
Editor’s note: So far, we’ve looked at the organic traffic source. But what if you want a more global view?
=> Enter .
It’s an “All Access Backstage Pass” that combines the insights of a tool like SimilarWeb with the engagement metrics of Google Analytics.
The Traffic Analytics Report provides estimated desktop and mobile traffic of any website, which you can use to uncover its traffic strategies.
Note: these reports are estimates (based on third-party clickstream data) because SEMrush does not have access to every website’s internal analytics.
#11: Look at Your Competitor’s Top-Level Traffic and Engagement Metrics (Across Mobile and Desktop Devices)
Let’s take a look at the Traffic Analytics report and see what metrics we can discover for the Wirecutter website.
In SEMrush:
- Select SEO Toolkit.
- Click on Traffic Analytics from the side menu.
- Enter the domain – e.g. “thewirecutter.com” – you want to analyze.
- Click Search:
The Traffic Overview report provides an estimate of the queried domain’s top-level traffic and engagement and metrics.
You can apply filters – historical data, location, and device – to modify the results. And next to the filters is a set of blue bars noting the ‘Estimated Accuracy’ of the report, which is based on the size of the domain and filters. In our example, Wirecutter has 3 bars, which means the data is “pretty much” accurate:
Let’s examine the Wirecutter’s top-level traffic and engagement metrics for all regions, on both desktop and mobile, in July 2019:
- Visits – an estimate of total visits to the website over the chosen month – e.g. Wirecutter had an estimated 6.4M visits, which is a slight increase (+13.70%) compared to the previous month.
- Unique Visitors – an estimate of total unique visits to the website over the chosen month – e.g. Wirecutter had an estimated 3.8M unique visitors, which is a slight increase (+14.05%) compared to the previous month.
- Pages/Visit – an estimate of how many pages (on average) a person visits in one session on the website – e.g. on average, Wirecutter visitors checked 2.47 pages per visit, slightly down on the previous month.
- Avg. Visit Duration – an average estimate of the amount of time spent on the site during each visit – e.g. on average, Wirecutter visitors spent almost six minutes per visit, slightly up (+12.09%) on the previous month.
- Bounce Rate – an estimate of the website’s average bounce rate, or percentage of visitors that leave the website after viewing just one page – e.g. 72.10% of visitors leave the Wirecutter site after viewing one page.
Below the top-level metrics, you can view a selection of historical trends:
You can switch between Total Visits, Unique Visitors, Average Visit Duration, and Bounce Rate. And you can also select the timeframe – 6 months, 12 months, or All-Time.
The trend lines are for All Devices (blue), Desktop (green), and Mobile (orange).
In our example, you can see visits to the Wirecutter have peaked and troughed over the last 12 months, hitting a high in November and a low in February, which indicates they get seasonal/holiday variations.
It’s also interesting to note that in the last six months, mobile visits have increased while desktop visits have decreased.
The Traffic Overview report also lets you compare your website against competitors.
At the top of the page, you can enter up to four competitors plus your site. For example, you could compare Wirecutter and TechRadar:
The report lets you compare metrics side-by-side. Notice that although TechRadar gets loads more traffic than Wirecutter, many other engagement metrics are similar – e.g. average visit duration and bounce rate.
You can see this in the trend graphs too:
Over the last 12 months, Wirecutter has increased their average visit duration to match TechRadar.
Editor’s note:
Check out this step-by-step guide on how to analyze your competitor’s entire online traffic strategy:
You’ll get access to the traffic analysis template shown above.
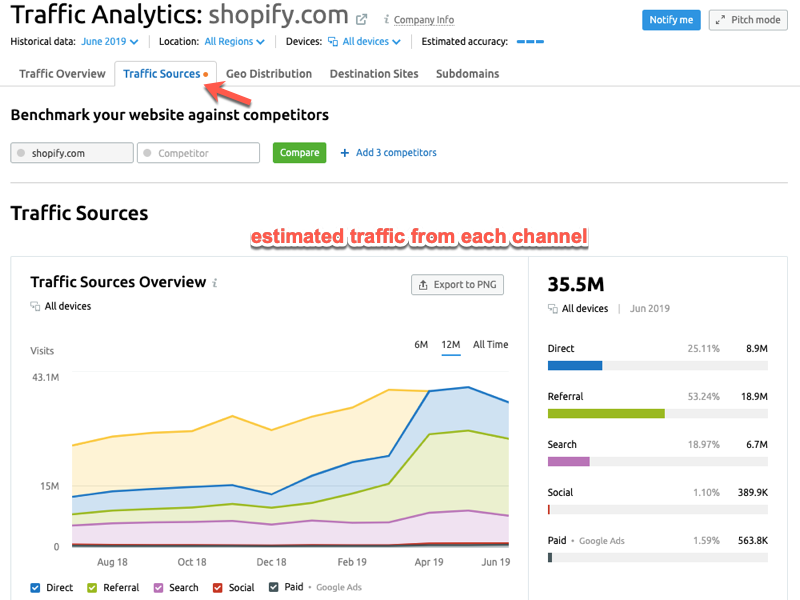
#12: Analyze Traffic Sources to Dial in Your Digital Marketing Strategy
The Traffic Sources report shows how much traffic is coming from each channel – Direct, Referral, Search, Social, and Paid:
You can view the trend data plus last month’s figures.
For Wirecutter, you can see that almost half (46.01%) of their traffic comes from search engines. Direct and referral traffic provide most of the other half, with a tiny amount coming from social media. Wirecutter doesn’t spend any money on paid advertising.
Want to dig a little deeper?
No problem.
SEMrush provides more details on the traffic sources. For example, you can see that Wirecutter gets most of its referral traffic from Amazon, the NYTimes, and its Email Subscribers:
Note: “list-manage.com” refers to the MailChimp email marketing service.
Editor’s note:
The traffic referral sources can make for great link building targets
Look for the domains that are sending your competitors the most traffic, and then head over to the Backlink Analytics toolkit to discover more about their link building practice.
But which countries drive the most traffic?
Unsurprisingly, Wirecutter gets most of its traffic from the USA:
What’s interesting to note here is that the US, Canada, and the UK have a relatively even split between desktop and mobile traffic. But Australia and Germany are heavily weighted towards desktop traffic.
SEMrush Free Trials: Test Drive SEMrush PRO for 30 Days, GURU for 14 Days or PRO + Traffic Analytics for 14 Days
Editor’s note: So far, we’ve looked at some of the top competitor organic traffic analysis.
Now we’re going to switch gears and focus on some of the link building applications.
SEMrush recently overhauled and expanded its backlink database:
#13: Find (And Remove) Toxic Backlinks Using the Backlink Audit Tool
The Backlink Audit Tool checks your domain’s backlink profile to help you avoid Google penalties related to toxic backlinks. You can audit all of your links, analyze the toxic score and markers, request website owners to remove toxic backlinks, and ultimately create a disavow file to send to Google.
Here’s how it works…
In SEMrush:
- Select SEO Toolkit.
- Select Backlink Audit from the sidebar menu.
- Select from your list of projects – e.g. robbierichards.com:
Once you’ve run a backlink audit, you have the latest results displayed:
In the top right-hand corner, you can click on Integrations to connect Google Search Console and Google Analytics:
- Search Console lets you access extra backlinks for your analysis, get up-to-date info on disavowed backlinks, and update your disavow file with just one click.
- Google Analytics gives you the updated Toxic Score for affected backlinks.
On the Overview report, you can see the Domains by Toxic Score showing colored segments of toxic (red), potentially toxic (orange), and non-toxic (green):
Clicking on the View full report button takes you to the Audit report. Here you can review the toxicity level of each referring domain, based on 45 toxic markers:
- 60-100 means the domain is Toxic
- 45-59 means the domain is Potentially Toxic
If you click on the toxic score, you can see why the domain has been flagged:
On each line of the report, you have 3 options:
- Click Delete > To Disavow – requests Google to ignore your toxic backlink
- Click Delete > To Remove – requests domain owners to remove the backlink
- Click Keep > To Whitelist – adds the link to your safe list of domains
Plus, you can add your comments about the domain:
If you choose to disavow the backlink, it’s moved to the Disavow tab:
From here, you can prepare a single file with all the toxic backlinks you want to be ignored by Google, export it, and then upload it to the Google Disavow Tool.
As potentially toxic backlinks can appear at any time, the Backlink Audit tool conducts a regular re-crawl of your website every two weeks, and you can also launch a crawl every week.
#14: Find (And Manage) Thousands of Link Prospects in Seconds with the Link Building Tool
Imagine if you could find, check, and manage thousands of link building prospects in seconds…
=> Enter the SEMrush .
Here’s how it works:
- Enter a list of target keywords + competitors and let SEMrush work its magic.
- Select the best prospects from the list SEMrush kicks back.
- Reach out and secure the link without ever leaving SEMrush.
Seriously, this tool is a game-changer!
Here’s how to do it:
In SEMrush:
Go into one of your projects and select the Link Building option:
Note: If you haven’t already set up a project within SEMrush, you’ll need to do this first.
Next, you’ll be prompted to add up to 10 keywords you want to earn high rankings for:
And up to 10 competitors:
Then click Start Link Building.
After a few minutes, SEMrush should kick back an Overview report that looks like this:
That’s a whopping 6,236 prospects in a matter of minutes!
Click on the Prospects tab to see more info:
The data for each prospect is extremely powerful. For example:
- The Rating tells you how difficult getting a link from this website is likely to be. The higher the rating, the more likely you’ll be able to add the link to your backlink profile.
- The Trust Score measures the quality of a domain based on its referring domains.
This data allows you to make decisions FAST.
All you have to do is to sift through the prospects, select the ones you want to pursue, and then use the drop-down to select an appropriate outreach strategy.
For example:
SEOSmarty is one of the prospects on my list, so I’m going to select Guest post outreach from the drop-down selection:
The prospect is moved automatically to the In progress tab:
Starting outreach for this prospect is as simple as hitting the Send button, which brings up an email composition area where you can craft the perfect message and send the outreach email:
Click ‘Send and proceed to next’ to complete the outreach process.
This saves a ton of time when compared to exporting data to third-party tools!
#15: Find High-Quality Link Building Opportunities
SEMrush lets you analyze your competitor backlinks profiles. You can uncover the number of backlinks, referring domains, follow/no follow split, and top level domain distribution.
These features can help you better understand your competitor’s link building strategy and highlight new sources you can tap into to build backlinks and referral traffic.
Let’s take a look.
In SEMrush:
- Select SEO Toolkit.
- Click on Backlink Analytics from the side menu.
- Enter the domain – e.g. “backlinko.com” – you want to analyze.
- Click the ‘Check It’ button:
The Overview report gives you a high-level view of the backlinks:
Pay attention to the number of referring domains, as it’s a strong indicator of the diversity of your competitor’s link profile. Plus, a large number of relevant referring domains will boost a site’s overall domain authority.
Further down the page, you can see more details about the backlinks:
For example, 98% of Backlinko’s backlinks are ‘text’ links, and 74% of the backlinks are ‘follow’ links. Both of these metrics are indicators of a killer backlink profile.
The Referring Domains tab highlights the TLD distribution and originating country of the backlinks:
Backlinko gets most links from ‘.com’ sites but there are also links from ‘.gov’, ‘.edu’, and ‘.org’ domains, which will typically pass more authority onto your site.
Scroll down and you’ll see a table containing all the domains sending backlinks to the website:
In our example, you can see Backlinko has some high authority referring domains, including Libsyn and QuickSprout. .
Editor’s note:
Look closely at the type of sites linking to your competitor.
In this case, it looks like Brian is active on forums such as Warrior Forum and Inbound.org. These are communities you could start engaging in to drive traffic to your site.
He also has a large number of links coming from searchengineland.com and kikolani.com. He might be guest posting there. Maybe an opportunity to pitch a guest post of your own…
He has 46 backlinks coming from Scoop.it. This could indicate that he is leveraging the social channel to promote his content.
Backlinko is getting links from AllTop indicating that he may have submitted his domain to the directory.
Smart move. AllTop provides authoritative backlinks for hundreds of different business categories. Use these insights to guide your own content and link building strategies.
Ok, so now you know which domains are linking to your competitor…
Now, it’s time to check which specific pages are linking and see exactly how they are getting their links.
Are they using guest posts, forum marketing, or directory submissions to build links and drive traffic?
Let’s find out.
Click on the Backlinks tab and scroll down the page:
Here you can see:
- the page and trust scores
- the backlink source
- the anchor text
- the page that received the backlink
- the type of link (text, image, etc.)
- the follow/no-follow tag
In our example, you can see that Backlinko has a nice mix of brand, keyword, and naked URL anchor text.
Penguin-Proof.
So, you have a huge list of backlink URLs…
But, how the heck do you extract actionable insights?
Advanced Filters let you search for backlinks by Anchor text, Referring domain, New & Lost, Sitewide, IP address, and Zone.
For example, you could filter the results by ‘zone’ and ‘.org’ to see where Backlinko gets those types of backlinks from:
Now you get a list of only those ‘.org’ sites linking to the domain.
See if there are any backlinks you can replicate in your own link building campaign.
#16: Identify “Linkable” Asset and Content Types
How would you like to know which specific pages on your competitor’s website are attracting the most links?
Staying in Backlink Analytics, select the Indexed Pages tab where you’ll see a list of your competitor’s best link building assets:
Sort the Domains column to return results in descending order.
Aside from the homepage, Backlinko’s list of Google ranking factors has attracted the most referring domain backlinks.
If you’re in the SEO/link building space, you instantly know that content targeting this subject could be used to build links and traffic.
Take a look at which of your competitor’s posts/pages are generating the most backlinks. This will give you an idea of the types of linkable content you can incorporate into your own content strategy.
Explore the content in-depth and see if there are any opportunities to expand and make it better.
This insight forms the foundation of my content promotion strategy.
Enter your competitor’s domain and check the Indexed Pages report to find which posts and pages are attracting the most backlinks and referring domains.
Click the Referring Domains link and see how different sites are linking to your competitor’s content.
Are your competitors building links from guest posts, roundups, resource pages, or blog comments?
Now you know which topics generate the most links and where your competitors are getting those links. The next step is to build a superior piece of content and replicate as many links as possible. Or, at least use the insights to guide your own link building strategy.
.
#17: Quickly Find (And Fill) Backlink Gaps
The Backlink Gap Tool lets you compare the backlink profiles of up to five competing sites. And if you’re not too sure which sites to enter, SEMrush auto-suggests competitors.
In SEMrush:
- Select SEO Toolkit.
- Click on from the side menu.
- Enter the domains – e.g. “backlinko.com”, “neilpatel.com” – you want to analyze.
- Click on the ‘green’ button:
The trend graph gives you a quick overview of which domains are building the most backlinks. You can switch the timeframe between the past 3 months, past year or all time.
In this example, you can both Neil Patel and Ahrefs have more backlinks than Backlinko, so there are definitely gaps to target.
Scroll down the page to see the comparison table showing which referring domains are linking to each competing site:
To view backlink opportunities that you’re missing, select your domain from the dropdown box. For example, if you select Backlinko, you’ll now see a list where Backlinko has zero backlinks, but other sites do:
Looking at the results, Backlinko can see Neil Patel has over a thousand links from Microsoft, so maybe that’s a site to target and fill his backlink gap. Or perhaps he wants to target Blogger who’ve linked to Ahrefs?
The Backlink Gap report gives you a quick way of identifying your next link building targets.
Try entering the domains for you and your competitor(s) to identify your backlink gaps.
#18: Reclaim Lost Backlinks
After working hard to build valuable new backlinks, the last thing you want is to lose them.
But it happens.
Sometimes it’s down to a change in a referring domain’s website structure or content. Or perhaps your own site has changed?
Other lost links could be deliberate removals by the referring domain. Either way, it pays to check if you’ve lost any backlinks and if so, set about getting them back.
To do this, head back to the Backlink Analytics tool and select the Backlinks tab.
Next, you’ll need to make the following selections:
- Check the Lost backlinks.
- Select the Follow filter.
- Sort by the Page Score in descending order:
Now you have a list that shows your lost ‘follow’ backlinks from the most trusted domains.
#19: Identify Broken Link Building Opportunities
Not many people know that you can use SEMrush to run your broken link building campaigns.
Here’s how to do it:
In SEMrush, add your competitor’s website as a New Project and run a Backlink Audit.
Once the audit has finished, go to the Lost & Found tab, scroll down the page, and filter the data with ‘State = Broken’ and “Group by URL’:
The report shows all the broken links pointing to your chosen domain
Now, you can contact each website owner and advise them of all their broken links. Often, the broken links are caused by a 404 Error when pages are deleted. So you can offer them a new piece of content to link to and gain a valuable backlink.
This is a win-win for the website owner as they get to fix a broken link with a fresh piece of content.
#20: Analyze Link Sources at Scale with the Bulk Backlink Analysis Tool
OK, let’s assume you’ve looked through your competitor’s backlinks and identified a bunch of websites they’ve written guest posts for.
But how do you know which one of these websites has the best traffic potential?
And how do you know which website will give you the most powerful link(s)?
The (formerly known as the Quick Batch Tool) allows you to compare up to 200 URLs quickly. It kicks back a bunch of metrics on one screen that will help you to make decisions…FAST.
For example, I pasted a few guest posts by Brian Dean (from Backlinko) into the tool and selected ‘Root Domain’ under the Results scope dropdown:
If we order by Authority Score (AS), we can see that getting a guest post on Entrepreneur will probably result in the most powerful link, closely followed by Buffer and Ahrefs.
Editor’s note: Authority Score is a compound metric used to gauge a domain’s overall quality and influence on SEO.
The score is based on the domain’s domain score, trust score, quantity of backlinks, quantity of referring domains, quantity of referring IPs, correlation between domain score and trust score, follow vs. nofollow links, organic search traffic (from our Organic Positions report), and number of users (from our Traffic Analytics report).
You can also use the Bulk Analysis Tool for finding ‘skyscraper’ content ideas.
Let’s say you have a list of URLs from a bunch of different websites.
Maybe you scraped Google SERPs for a term like “link building”.
Paste these into Bulk Analysis Tool and select ‘URL’ under the Results Scope option:
And then order the results by Domains to uncover the pages with the most referring domains:
These are potentially great “skyscraper” content ideas.
- Paste a list of URLs into the textbox (one per line).
- Select URL or Domain under Results Scope (depending on whether you want to analyze the entire domain or just the URL).
- Order by the metric you’re interested in (e.g. AS when researching guest post opportunities or Domains when researching potential “skyscraper” content ideas).
#21: Track Keywords from Any Location in the World (Across Any Device)
Keyword rankings are key to any successful SEO or PPC strategy. The higher you rank in the SERPs, the more traffic and potential customers you will drive to your website.
SEMrush’ allows you to monitor a website’s daily ranking for your chosen keywords. You can track national, regional, and local search rankings for any domain or keyword, across any device – mobile, tablet, and desktop.
As you can imagine, the tool is packed with data, so let’s look at some of the reports available to you…
The new Position Tracking Landscape report is fantastic. It gives you a quick view of everything you’re tracking, including your domain’s trend for visibility, estimated traffic, and average position, plus your top keywords and rankings distribution:
Next up is the Overview report. Here you can see a summary of your domain’s visibility, estimated traffic, and average position for every keyword you’re tracking.
Here’s what the Visibility Trend looks like:
The Visibility Trend is based on the average position of the domain’s ranking pages. So in this example, you can see the domain is on an upward trend, especially over the last 7 days.
Below the Visibility Trend is the Rankings Overview table where you can manage your keywords:
There’s a row for every keyword in your campaign, and you can measure progress against Positions, Estimated Traffic, and Visibility.
There’s also an option to tag your keywords, which helps to filter ranking reports. For example, you could add the date you started tracking the keyword or note their search intent.
The Tags Manager allows you to add or remove tags from any keywords in your campaign. You can get to the Tags Manager by clicking the Tags filter and then selecting “Manage tags” :
The next tab in the Position Tracking tool is the Rankings Distribution report:
(Source)
The first table compares the overall Visibility and Estimated Traffic between you and your competitors.
The remaining tables display all of the rankings that you and your competitors have in the Top 3, Top 10, Top 20, and Top 100 positions.
SEMrush Free Trials: Test Drive SEMrush PRO for 30 Days, GURU for 14 Days or PRO + Traffic Analytics for 14 Days
#22: Keep an Eye on SERP Volatility with SEMrush Sensor
Google makes minor algorithm updates almost daily, meaning the SERPs can be pretty volatile.
However, the SERPs are more volatile on some days than others.
And they’re also more volatile for some industries.
So it’s worth bearing this in mind when your rankings suddenly jump up or slide down for no particular reason.
You may not have done anything wrong.
But there’s a quick way to check…
The shows the SERP volatility for the last 30 days:
It’s a useful tool to see how your site compares to the rest of the web. Plus, it can also help spot algorithm changes.
You can even drill down into various categories to check SERP volatility in different niches. For example, the Sports niche has been more volatile than others for the last few days:
SEMrush advises that “Google results are shaking up, and maybe a sign of a possible algorithm change. Check if your site has been affected.”
However, this is pretty standard. Why? Because sports-related queries often require fresh content, such as the latest scores and results. So Google frequently moves websites around in the SERPs.
Aside from general volatility, you can monitor your website in the Personal Score tab:
The report looks at the keywords you’re ranking for and checks SERP volatility for them.
And it looks like I have nothing to worry about at the moment.
I usually check this periodically and, if I see that my Personal Score is much higher than the average for my niche (i.e. the “Internet and Telecom” category), I’ll investigate things a little further.
#23: Optimize Your Content with the On-Page SEO Checker
The provides a structured list of things you could do to improve the rankings of pages on your website.
The report includes on-page SEO ideas, semantically related words to include on your pages, target content length, readability, and backlink prospects.
SEMrush calculates the optimization ideas based on the Top 10 real-time competitors for each of your target pages and keywords.
The Overview report displays the total number of suggested ideas, an estimation of how much traffic the ideas could help you gain, and a short table with the suggested pages to optimize first:
From the report, you can click the links to investigate the optimization ideas further.
Or you can head straight to the Optimization Ideas tab where you’ll see a list of all the suggestions:
You can sort the table by Priority, URL, Keywords, Total Volume, Last Update, or the number or type of ideas.
The On-Page SEO Checker advises what action you should take and what benefits you can expect as a result. It’s an excellent way to start analyzing your site.
Advertising Toolkit Review and Tutorial
I run a lot of paid search campaigns for clients across a wide range of verticals.
Everything from real estate to agriculture to dentists to marine electronics.
SEMrush is one of the first tools I use to start planning out my campaigns. It allows me to see which keywords my competitors are bidding on, where they rank, as well as the ad copy and destination URLs they are using to increase quality score and conversions.
SEMrush eliminates the guesswork and avoids a lot of wasted time and money testing a PPC campaign so you can start with a proven roadmap for success.
The contains all the tools and reports you need to run your PPC campaigns organized in three sections:
- Competitive Analysis
- Keyword Research
- Ad Research and Creation
Here are a few reports you can use to beef up your ad campaigns and make your dollars do work!
#24: Analyze Competitor Spend and Traffic Trends
The Advertising Research Positions report gives you an overview of your competitor’s use of advertising. At the top of the page, you can see the headline metrics for keywords, traffic, and traffic cost:
As you scroll down the page, you can see the trend graphs for each metric:
You can adjust the date range of the trends between 1 month, 6 months, 1 year, 2 years, and ‘All time’.
The trend graphs let you gauge whether a competitor is spending more or less each month on ads. Any trends you spot, you can analyze deeper.
If it’s increasing, drill into the position changes report to see NEW or LOST keywords to get an idea of where this is coming from – see section #28 for more details.
It also gives you an idea of how much you’ll have to spend to get similar traffic levels. Or, how much traffic you can expect from specific topic categories.
#25. Where (And Why) Is the Competition Getting the Upper Hand in Paid Search
Want to know where your competitors are outranking you with their paid ads?
Move along to the Competitors Tab of the Advertising Research Toolkit. Scroll down to the Paid Competitors table, and click one of the Common Keywords links:
Similar to what we saw above in the SEO Toolkit, this opens a new window/tab with the Keyword Gap report. The comparison chart shows you all the common keywords that you and your competitor are bidding on in paid search.
Run two separate data filters:
1. Sort competitor keyword rankings in descending order:
You’ll be able to see which paid keywords the competitor is outranking you for. For example, Kareo is outranking Athena Health for these keywords:
Your job?
=> To find out why.
- Do they have a larger ad budget?
- Is competition driving up the average CPC?
- How well optimized is their ad copy and landing page experience?
- Are they using custom campaign landing pages?
Look for areas of improvement within your own ad campaign.
For example:
Athenahealth is ranking #7 for “best EHR programs”, whereas Kareo is ranking #1.
Click the keyword, and you’ll be taken to an overview report where you can see the ad copy used to target that keyword:
Click on the ad, and you’ll be taken to a custom campaign landing page, or in this example a redirect to the Kareo homepage:
You’ll notice the page is optimized for the target keyword, there is loads of social proof, a scrolling contact widget to contact the team by phone, chat message or email.
How does your ad copy and landing page experience stack up?
2. Sort common keywords search volume by descending order:
Now you can see all the common keywords sorted from highest to lowest search volume.
This is a quick way to find all the high-traffic keyword opportunities you are not taking advantage of.
You might need to increase your keyword bids or optimize your ad copy and landing page layout to improve your quality score and rankings.
3. Sort common keywords competitive score in ascending order:
Now you can see the common keywords sorted from the lowest to the highest level of competition.
This not only gives you a quick overview of the overall keyword competitiveness but sometimes also reveals new low-competition keyword opportunities you might not have previously thought of.
This is really helpful if you have a small PPC budget because typically lower competition keywords have MUCH lower CPCs.
#26: Track PPC Competitors, Find New Keyword Opportunities, and Reduce Wasted Ad Spend
Your competitor’s PPC campaign will constantly be changing.
The Position Changes report allows you to monitor daily changes in your competitors paid search campaign:
- Get updated when your competitors target new keywords or launch new ad copy.
- Target ads when your competitors are losing visibility.
- Optimize and improve your ad’s relevance by monitoring when your competitor’s update landing pages.
You can see the primary navigation markers at the top of the report (above):
- New Keywords – shows keywords where the domain has started ranking an ad in Google’s Top Paid 8 positions (and was not ranking at the time of the previous update).
- Lost Keywords – shows all the keywords where your competitor has fallen out of the rankings.
- The Improved and Declined Keywords filters show all keywords where your competitor is gaining and losing ground in the paid ad rankings.
You should always be on the lookout for new opportunities to increase traffic and sales from paid ads.
This report makes it easy to find opportunities and identify low-performing keywords before you spend a ton of time and money running A/B tests.
1. Look through the New Keywords report and look for any new offers or products your competitor might be promoting. Pay attention to the keywords and ad copy by hovering over the green ad icon:
These insights could generate new campaign and product development ideas.
2. Click the Improved tab to look at all the keywords that have increased in position:
Sort the report by Diff (Position Difference) to see which ads have improved the most. This can usually be attributed to an increased budget.
If your competitor is bidding more on the keyword, it might be an indication that a particular keyword is converting well and want to incorporate into your own campaign.
3. The Declined tab will show all the ads that have decreased in position:
Sort the report by Diff (Position Difference) to show the keywords with the largest drop in rankings.
Typically, a significant decrease in rankings will indicate your competitor has stopped bidding on those keywords. This is usually a sign that it was an underperforming keyword with a low conversion rate.
This kind of insight can save you a lot of time and money running different A/B tests.
#27: Write Attention-Grabbing Headlines, Increase Click-Through Rates, and Get More Traffic from Paid Search
You can target all the right keywords and have highly-optimized campaign landing pages, but without the right ad copy, your campaign can still fall flat on its face.
The Ad Copies report will show you all the ad copy your competitors are using in an aggregated report, along with all the keywords triggering the ad copy:
Use the insights to:
- Write “attention-grabbing” headlines
- Write better ad descriptions and CTAs to get more people clicking through to your landing pages
- Optimize display URLs
1. Headlines have the greatest impact on whether someone reads an article, opens an email, or in this case, reads the rest of your ad.
Analyze the successful ad copy of your competitor’s to see which headlines they are using to capture attention in paid search:
What type of headlines are they using to attract attention?
- Shock value?
- Emotional appeal?
- Brand mentions reinforcing trust?
By modeling the headline formula of your top competitors, you can quickly capture more attention, boost your CTR, and increase overall quality score. This will help lower CPC and drive more traffic to your landing pages.
2. The next step is to look at the description copy.
- Are your competitors using alphanumeric numbers to stand out?
- What type of offers are they using to draw the click?
- What CTAs are they using?
3. Display URLs can have a big impact on the relevancy and CTR on your ads.
Look at patterns across your competitor’s ads:
- Are they using keyword-rich display URLs to boost quality score?
- Are they using dynamic keyword insertion to increase relevance?
- Are they using product names in the URL?
4. Click the ‘Keywords’ link to reveal all the keywords triggering the ad:
Look for new keyword opportunities to see how well each ad is ranking.
You can export and sort the data to find new low competition/ CPC keywords to target.
#28: Unearth High-Converting Ad Copy Formulas
Don’t spend loads of time and money testing ad copy and keywords.
Instead, let your competitors do all that heavy lifting while you reap the rewards.
The Ads History report allows you to determine when, and how often your competitors bid on each keyword.
If you notice that your competitors have bid on a particular keyword over a long period, it’s safe to assume it’s a profitable keyword.
You can also uncover which ad copy is performing best by looking at the historical data.
In SEMrush:
- Select Advertising Toolkit.
- Click on Advertising Research from the side menu.
- Enter your competitor’s domain – e.g. athenahealth.com
- Select the Ad History tab:
You’ll see a table that looks like this:
If the cell is filled blue, then your competitor was bidding on the keyword that month.
The keywords showing blue for each month are likely high performing since they have chosen to bid on them for over a year straight.
Click on a blue cell, and you’ll see which ad copy they are using to target each keyword:
You can use these insights to see the different types of ad copy your competitors have been testing.
- If you notice they have used the same ad copy for a long period, you can predict that this ad copy converts well.
- But, if you notice that your competitors tried different ad copy and then quickly changed it the next month, then it must not have performed as well.
Use your competitor’s historical ad data to optimize your own ad copy and keyword bids without having to spend a lot of money testing.
Enter your competitor’s domain into the Ads History report and look for trends.
If your competitor has bid on a specific keyword or ran the same ad copy for a long time, it likely converts well. You might want to replicate some of their ad copy and bid on those keywords.
If you notice that they bid on a particular keyword for a few months and then discontinued, you can determine that keyword did NOT perform well and elect to remove it from your paid keyword list.
The allows you to write ad copy and headlines for your PPC campaigns based on your competitor’s ads. And, even better, when your ad is finished, you can upload it straight to the Google Ads Editor.
The main benefit of the Ad Builder is that it lets you see exactly how your competitors structure their successful ads – and then replicate them.
Start with the Ad Research tab and enter your competitor’s domain to see their ads:
If you see an ad that you think you could modify and use, then click the ‘+’ button in the top right corner:
Then customize the (1) headlines, (2) description, and (3) display URL to fit your campaign, and choose which (4) campaign group to use:
As you edit the text, you see a preview of how it will look. Once you’re happy with the ad copy, save it to your campaigns:
The final step is to export your customized ads to a ‘.CSV’ file, which can then be imported into your Google AdWords Editor program.
#29: Uncover Competitor Pricing Strategy with Product Listing Ads
The new PLA () Research Tool lets you analyze the performance of an advertiser’s Google Shopping ad campaigns.
PLAs typically have the highest CTRs, and in my experience, conversion rates. This can be attributed to the top-of-page ad placement and visual real estate they occupy in the SERPs. Plus, they are positioned more for bottom-funnel traffic.
The PLA Positions report is great for analyzing the pricing strategy of your top competitors. You can view the PLAs, their keywords, ranking position, search volume, product title, and URL:
And my favorite…product prices:
You can use the PLA Copies report to gauge the pricing strategy used by competitors:
In the main part of the report, you’ll see the ads of competitors that Google likes the most. The more keywords an ad has, the more it shows up in SERPs, and the more likely potential customers will see it and click it.
The Product Price filter lets you view your competitors’ highest- and lowest-priced products. You can also sort results according to the number of keywords and price:
[Source]
You can use this data to help you optimize your PLAs with better titles, descriptions, and pricing.
Enter five of your top competitors into the PLA Positions report.
Make a note of your competitor’s pricing strategy.
Sort the PLAs by position.
Click through to the landing pages of the top-ranking ads and see how they have optimized the landing page experience.
Do they incorporate keywords in the PLA title, landing page headers, and body copy?
#30: Quickly Find Gaps in Your Paid Search and PLA Strategy
Earlier, in section #4, you saw how to use the Keyword Gap tool for organic traffic.
Using the same principles, we can find keyword gaps for Paid Search and PLA.
IMPORTANT: You MUST enter your competitor’s domains first, with your own domain last on the list.
In SEMrush:
- Select Advertising Toolkit.
- Click on Keyword Gap from the side menu.
- Enter the domains you want to compare – e.g. “kareo.com” and “athenahealth.com”.
- Select the “Unique to first domain’s keywords” intersection.
- Select Paid Keywords from the dropdown:
From the results table, Athenahealth can see the Paid Keywords that it’s missing out on compared to Kareo:
You can run the same kind of report for PLA Keywords. Repeat the steps above but change the dropdown selection to PLA. You can also add filters to narrow the selection.
For example, here are the PLA keywords containing “laptop” unique to Walmart that Amazon might want to target:
Using the Keyword Gap tool before starting either a Paid or PLA campaign can help you identify keywords to include.
#31: Dissect Competitor Display Ad Campaigns
The Display Advertising report provides a handy overview of your competitor’s display campaign activity.
You’ll be able to see if a competitor is advertising on Google’s display network, publishing ads on their own site to monetize traffic through AdSense, or both.
Go to the Overview tab and enter your competitor’s domain:
In this example, DigitalMarketer is currently promoting 2.8K display ads across 6.8K domains. The report also shows audience gender and age range they’re targeting.
As you scroll down the page, you gather more info:
- There’s a sample of the different types of ads (Image/HTML/Text):
- The top publishers and their industry/niche:
- The countries where they’re advertising and the type of ads they’re using:
In the Publishers report, you can see where the competitor is advertising, and exactly how many ads appear on that domain:
If you click the “ads” hyperlink, you’ll even be able to see the exact ad copy used on that website:
But it doesn’t end there…
On the Landing Pages report, you can see the landing pages the advertiser is directing their ads to:
In our example, DigitalMarketer has 455 ads pointing to this landing page.
This information is insanely useful for figuring out what type of offers are converting for your competitors.
Enter your competitor’s domain and look at the following reports:
1. Overview Table
Is your competitor an advertiser, publisher, or both?
2. Text vs. Media Ads
If your competitor is advertising on the display network, find out what percentage of ads are text vs. image-based.
3. Trend Graph
Is your competitor showing ads on more sites?
If so, this could indicate the display campaign is performing well.
Are the number of publishers decreasing?
This could indicate one of two things. Either the campaign is not delivering a good ROI, so the competitor is cutting back investment in display ads. Or they are excluding underperforming placements and building a more targeted campaign.
Either way, start your display campaign with the few remaining sites because you know those are still being targeted for a reason 🙂
4. Ad Reports
Click through and compare the Text and Image ads:
Filter the report to identify which ad creatives have been in rotation the longest.
Usually, this will indicate a high-performing display ad you can model in your own campaign.
Take note of trends for each different ad type. This will help provide a little more context to the Publisher graph shown above.
5. Publishers
Look at all the various sites your competitor is showing ads on. You might find some targets you hadn’t thought of yet.
Check how many ads are being promoted on each site, whether they are text or image-based, and for how long the ads have been seen on the site.
The longer your competitor has been placing ads on a site could indicate it might be one to consider testing as a target placement in your own display campaign.
6. Landing Pages
Get a full list of all the landing pages your competitors are targeting with display ads. Check the ‘Times Seen’ and ‘Ads’ columns to get an idea which landing pages are being targeted the most.
#32: Show PPC Progress and Results
The My Reports builder – located in the Management Toolkit – makes it easy to build PDF reports from scratch or customize an existing template. It’s a great way to share PPC progress and results with your clients.
Use the drag-and-drop editor to add different sources, including PPC, from the left-hand menu panel into the report builder:
When you’re finished, you can email the report to your clients.
SEMrush’s Business Plan also allows you to generate white-label reports.
SEMrush Free Trials: Test Drive SEMrush PRO for 30 Days, GURU for 14 Days or PRO + Traffic Analytics for 14 Days
SEMrush’ comprises a set of tools designed to improve your existing content plan or research, write, and audit new content.
The tools in the suite include:
- Topic Research
- SEO Content Template
- Post Tracking
- Content Audit
#33: Uncover Quick Wins with a Technical Content Audit
The allows you to analyze content within the subfolders of your website and find the pages that need improvement.
Once you’ve selected the subfolders that you want to audit, you’re ready to start your content audit.
Note: You’ll need to connect your Google Analytics and Search Console to collect data about page views, sessions, bounce rate, etc:
There are two main tabs to use in this tool: Content Sets and Table.
Content Sets
SEMrush groups the audit results in Content Sets based on actions you need to take:
- Rewrite or remove. Pages published more than 24 months ago and viewed less than 15 times in the last 30 days are stored here.
- Need to update. Pages published more than 6 months ago and viewed less than 15 times in the last 30 days are stored here.
- Quick review. Pages published less than 6 months ago and viewed more than 150 times in the last 30 days are stored here.
- Poor content. Pages less than 200 words long are stored here.
You can also create customized content sets. For example, you may want to select content based on the number of words, shares, backlinks, etc:
For each content set, click on the ‘Start analyzing’ button to see what actions you need to take.
Table View
Alongside Content Sets is the Table tab where you can get an overview of your content:
The table is fully customizable, so you can remove unwanted columns and sort by others. Plus, you can also add custom columns to the table to personalize the metrics you want:
Filtering results
Now you’ve collected the data and arranged your table columns, you can start sorting and filtering results by different parameters. For example, you might want to sort by “lowest backlinks” or “oldest pages”.
Set tasks
As you work through the pages that require attention, you can add notes and set tasks like “optimize header tags” or “add a new paragraph about x”.
There’s also an option to send these tasks to Trello and Google Calendar for collaboration within your team.
Exporting Your Content Audit Results
Finally, there’s an option to export the audit results from Table View to Excel:
The export contains all of the audit pages and their metrics, plus there are links in some columns to jump back to the Content Audit so you can update the results:
#34: Use SERP Insights to Create Content Templates That Rank
The SEO Content Template helps you craft SEO-friendly content based on the Top 10 rivals for your target keyword.
This a huge time-saver because you’ll know exactly what type of content you need to create and the websites to acquire backlinks so you can rank on Page #1.
Here’s what to do…
In SEMrush:
- Select Content Marketing Toolkit.
- Select SEO Content Template from the sidebar menu.
- Enter the keywords – e.g. “link building strategies” – you want to analyze.
- Select your target settings – Country, Region, City, Language, Device – from the dropdown menu.
- Click ‘Create SEO Template’ button:
The SEO recommendations from SEMrush for your content are based on the Top 10 results:
Below the Top 10 SERP listing, you’ll get the key recommendations based on:
- Semantically related words – related topics to include in your content.
- Backlinks – target domains to acquire backlinks from.
- Readability – how easy it should be for users to read your content.
- Text length – how many words should be in your content.
Followed by examples of how your competitors use your target keyword:
You can also export the recommendations to a word document:
SEMrush’s Real-time Content Check also allows you to paste in content and check it against the Top 10 ranking results:
On the right-hand side, you can see your overall score plus the individual metrics like Readability, Word count, Semantic keywords, etc.
#35: Improve Readability and Rank Potential with the SEO Writing Assistant
The SEO Writing Assistant (SWA) lets you check the ranking potential and readability of a piece of content in real-time:
You can configure the SEO Writing Assistant as a Google Docs Add-on or WordPress plugin:
You can use an existing SEO Content Template (like we created in the previous section) or create a new piece of content directly in Google Docs.
The SEO Writing Assistant provides an overall score based on four areas:
- Readability – ease of reading, word count, title and content issues.
- SEO – target keywords, recommended keywords (semantically related), link issues, keyword stuffing.
- Tone of voice – based on the words you’re choosing to use, the rhythm, the word order, and pace.
- Originality – checks for signs of plagiarism.
Follow the recommendations to improve the readability and ranking of your content.
#36: Stay on Top of Brand Mentions and Online Reputation
The gives you a quick overview of how your campaigns are being received. You can go deeper into the insights with the corresponding tabs for mentions, statistics, and resources.
The Sentiment chart shows how well your brand name is being discussed online. If it’s mostly green, then you’re being well-received. But if it’s mostly red, then you may need to take action to manage your brand.
It’s also worth comparing the ‘Total Mentions’ and ‘With Backlink’ figures. For example, you can see that only 1.0K of the total 43.0K mentions have a backlink. These non-linked mentions are a potential source of gaining more backlinks to your domain.
SEMrush’s Management Toolkit contains a set of tools to help manage all your marketing campaigns from one place. You can receive timely notifications of all the events that influence your rankings, add your own notes, and report on your performance to clients.
Here’s what’s included:
- Projects
- My Reports
- Lead Generation Tool
- Marketing Calendar
- Notes
On top of the analysis tools in previous sections, SEMrush also offers a robust project tracking and reporting solution that spans all the different toolkits so you can monitor and report progress to your clients and/or boss.
Let’s take a look…
#37: Get a Top-Level View (And Spot Issues) Across All Digital Marketing Projects
SEMrush lets you set up 12 different tools to analyze all aspects of your digital marketing from one dashboard:
- Site Audit
- Position Tracking
- Organic Traffic Insights
- On-Page SEO Checker
- Backlink Audit Tool
- Link Building Tool
- Social Media Tracker
- Social Media Poster
- Brand Monitoring
- Content Analyzer
- PPC Keyword Tool
- Ad Builder
Note: You don’t have to set up and configure every tool. For example, if you require Position Tracking and Link Building, just select those. You can always add more later.
Once your selected tools are running, the My Projects dashboard will display previews of each tool’s main metrics.
From the dashboard, you can see all of the Projects under your account. You can switch views between:
- All Projects (including those shared with your account).
- Projects you’ve created.
- Projects shared with you.
- Projects where you are the “Admin”.
The Manage Columns button lets you customize the dashboard to show only the tools most relevant to you and your business:
The tool allows you to share and collaborate on projects with colleagues and clients, plus track progress with email reports and graphs.
#38: Build Professional White Label Reports (in Minutes)
An essential part of any marketing is measuring performance.
For a lot of companies, this comes as a monthly report highlighting metrics such as organic traffic increases, new keyword rankings, PPC traffic, and more.
SEMrush’s Reports
tool allows you to build professional branded campaign reports by simply dragging and dropping widgets into their pre-built reporting template:
Select the report widget from the left menu, enter the domain URL, and select the device type.
You can also drag-and-drop heading and text blocks to organize data and add commentary to key metrics in the report, and use the layout widgets to create columns:
It’s difficult to illustrate just how powerful this can be, but I’ll try to give a quick example…
Let’s assume we were doing SEO for SEMrush.
We’ve been executing a few link building strategies over the past 3 months, and now we want to create a report that tells the rest of the team the following data points:
- A visual representation of new and lost backlinks over the last 3 months.
- How many of these were dofollow vs. nofollow.
- How these links contributed to organic traffic increases.
Here’s the (elementary) sample report:
Social Media Management Toolkit
SEMrush’s provides two tools to make your social media management activities easier.
The Social Media Poster lets you draft, schedule, and post content to different social platforms – Facebook (Business pages), Instagram (Business profile), Twitter, and Pinterest – without leaving SEMrush.
The Social Media Tracker lets you track the social media accounts of your competitors so you can compare their growth and engagement levels with your accounts.
Editor’s note: I don’t use the tool for this use case, mainly just SEO and PPC. But it does provide a lot of value to folks looking for an all-in-one solution.
Click here to learn more about the Social Media Toolkit, or watch this video: URL.
SEMrush has three paid plans with the option to pay monthly or yearly:
The Pro plan is $99.95/month. If you’re an individual blogger or small agency, the PRO account will be plenty.
The Guru plan is $199.95/month and is designed for marketing agencies. It allows you to run 3 simultaneous sessions (multiple people can be logged in and working in the account at the same time), run more reports, and store historical data. You’ll also be able to create branded PDF reports for clients.
The Business plan is $399.95/month, and is ideal for larger agencies (up to 10 users) who are working with a ton of data each month across multiple clients campaigns. Aside from the increased data access, you’ll also be able to create white-label PDF reports and get access to the SEMrush API.
You can compare all the features in this handy comparison table.
Note: There’s also a free version of the tool with limited reporting features
SEMrush: A Digital Marketer’s Swiss Army Knife
There you have it – the most in-depth SEMrush review and tutorial you’ll find anywhere online.
SEMrush is my go-to tool for traffic analysis, SEO, PPC and competitor research. I use it every day to find keyword opportunities, analyze PPC campaigns, brainstorm content ideas, track rankings and perform in-depth competitor research for personal and client projects.
At $99.95, the tool provides a mountain of actionable data, that if acted upon, will pay dividends in a very short period of time.
If you’re a serious SEO or digital marketer, SEMrush is a smart investment. But, don’t just take my word for it. Use one of the trial links below to test it out and decide for yourself:
SEMrush Free Trials: Test Drive SEMrush PRO for 30 Days, GURU for 14 Days or PRO + Traffic Analytics for 14 Days
Did you find this SEMrush review helpful? Are there any ways you use the tool to get actionable insights that weren’t covered?
Please let me know in the comments below.
The post SEMrush Review & Tutorial: 38 Ways to Level-Up Your Digital Marketing in 2020 (Templates & Trial Link Inside) appeared first on Robbie Richards.